
My Story

I enjoy helping others cut through the noise to get what they need.
While some may find it overwhelming, I'm at my best when I get to straddle between strategy, data analysis, and process optimization... with a dose of creative design and coding.
But I started out in a different field: My time in international public policy saw me working under tight deadlines to sort out positions and briefs on issues like shipping's effects on climate change and the marine environment. Later, still in the public service, I moved into strategic planning, where I used research to advise senior management on key trends, among other things.
I discovered data visualizations and storytelling from outlets like Fivethirtyeight and the New York Times, and I loved the hybrid nature of the work.
Eventually, as my interest grew, I made a triple career switch to the private sector, a different industry, and a new role in tech. But I found that my skills in strategic communications continue to serve me well, even as I pick up new ones in analytics, digital product development, and change management.
Outside, you'll find me rock climbing, sipping craft beers, and on the lookout for local birds.
Talks etc.
I believe in the power of an inclusive community: I've supported Google's Women Developers Academy as a mentor and formerly served as the editor for She Loves Data, a nonprofit, to share stories to uplift and inspire women in tech.
As a self-guided, community-taught data professional, I also believe in sharing back what I've learned. Here's a archive of selected talks, articles, and musings.
Tech and Design Tips and How-tos
- The Magic of a Dataviz Comic-Outlier Conference 2022 Lightning Talk
- Using Topic Modeling to Dig into Tweeted Requests -Talk delivered for Google’s La Kopi @ Developers Space
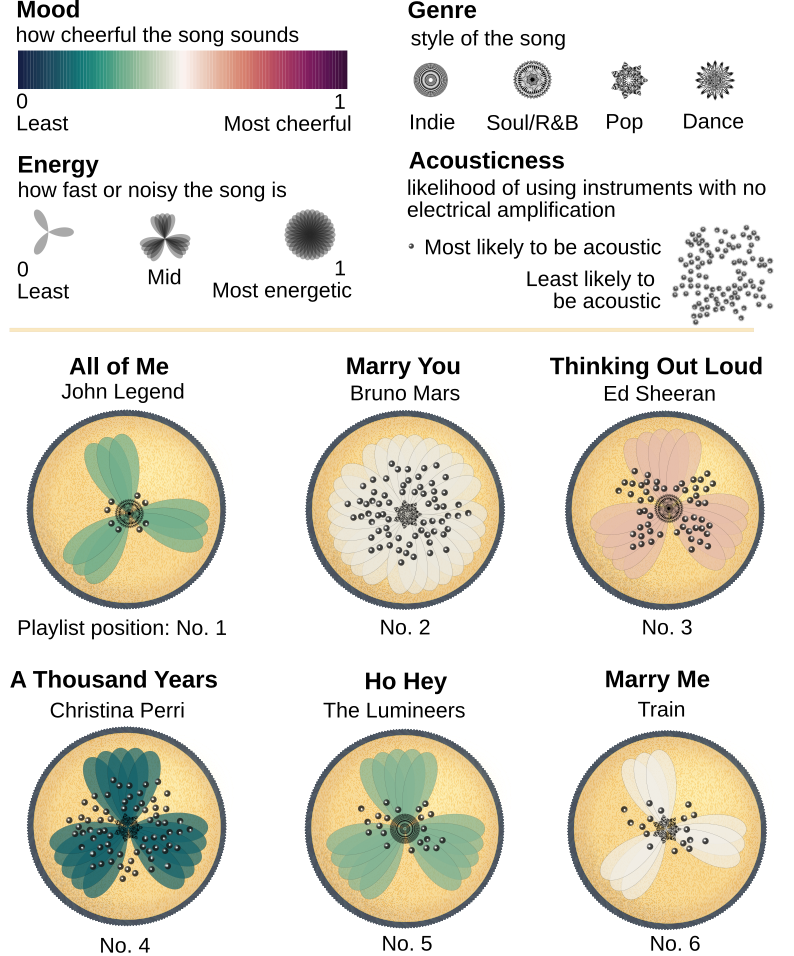
- Popular Wedding Songs Re-imagined as Cupcakes -Data viz process walkthrough
- Visualizing A Gender-Equality Paradox in R-Code walkthrough
Career + Core Skills for Healthy Work Life
- Meet the Community! Alexandra Khoo -interview with dataviz studio, Kontinentalist
- Humanizing Data: My Career Switch into Data Science -Talk delivered for Wanted Spotlight’s Breaking Data series
- Tips from My Journey into Data -interview with nonprofit, She Loves Data
- How to develop technical empathy — and why it’s worth your time -Guide for tech professionals